
Make a deal with Technoholic Experiment
🔒 Paid proposals held safely in escrow — released only when the work's approved.
Known for
 58.1K views
🔥 Powerful Mini Induction Heater | Red Hot Metal in Seconds! ⚡ #innovation #diyproject #diy
58.1K views
🔥 Powerful Mini Induction Heater | Red Hot Metal in Seconds! ⚡ #innovation #diyproject #diy
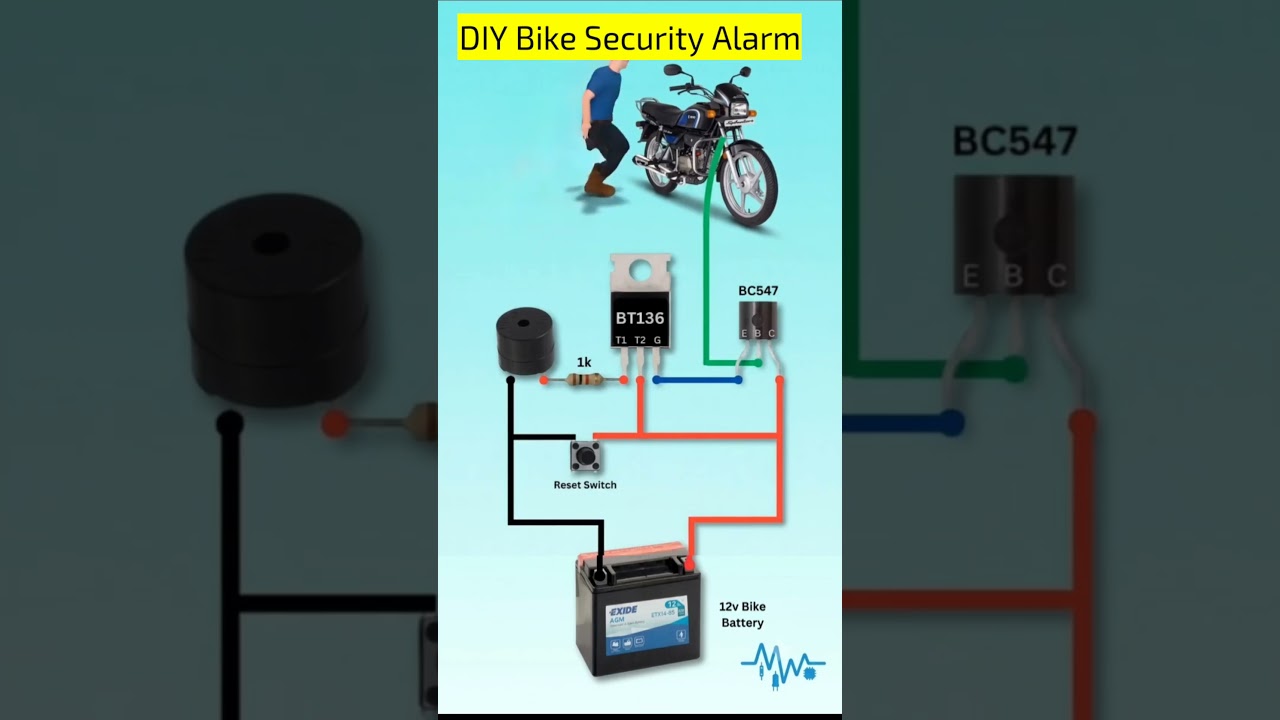 49K views
DIY Bike Security Alarm 🔥 | Anti-Theft Bike Alarm System | Easy Electronics Project
49K views
DIY Bike Security Alarm 🔥 | Anti-Theft Bike Alarm System | Easy Electronics Project
 46.5K views
🚰📱 Control Your Water Pump with Your Phone Using ESP32! 🌐⚡ #technology #diyelectronics #iotkits
46.5K views
🚰📱 Control Your Water Pump with Your Phone Using ESP32! 🌐⚡ #technology #diyelectronics #iotkits
 46.3K views
🔔 Automatic Door Bell Using IR Sensor 🚪✨ #technology #technology #innovation #futuretech #diy
46.3K views
🔔 Automatic Door Bell Using IR Sensor 🚪✨ #technology #technology #innovation #futuretech #diy
🎯 Reach quality
📈 Performance
💡 Facts
💚 Brand affinity
EstimatedBrands Technoholic Experiment's audience is most likely to respond to — from detected sponsorships in this niche.
 Shopify
About
📸 Gallery


Recent videos
More like this
Find more →


Frequently asked questions
How much does Technoholic Experiment charge for a sponsorship?
How do I contact Technoholic Experiment for a brand deal or collaboration?
How many subscribers does Technoholic Experiment have?
✉ Message Technoholic Experiment
Reaching out to influencers is a Pro feature. Upgrade to message any influencer directly — perfect for brands and agencies booking sponsorships.
- ✓ Message any influencer from their listing
- ✓ The influencer gets notified by email
- ✓ Manage every conversation in one inbox
Already Pro? Log in.
🎤 Event / appearance with Technoholic Experiment
Booking an event / appearance is a Pro feature. Upgrade to book Technoholic Experiment for an in-person or virtual appearance — payment held safely in escrow until the event is done.
- ✓ Book them for events, livestreams, panels & more
- ✓ Technoholic Experiment gets notified by email
- ✓ Fee held in escrow, released after the appearance
Already Pro? Log in.
You're out of free requests this month
Free accounts get 5 per month. Go Pro for unlimited sponsor pitches, collab requests & sponsorship deals — plus featured placement, the Verified badge, free withdrawals and more.
Upgrade to Pro — $9.95/mo →Your free limit resets on the 1st of next month.
Auto-generated from YouTube's public data — no affiliation with or endorsement by SocialDB. Is this you? Claim it · Remove